
Notice
Recent Posts
Recent Comments
Link
| 일 | 월 | 화 | 수 | 목 | 금 | 토 |
|---|---|---|---|---|---|---|
| 1 | 2 | 3 | ||||
| 4 | 5 | 6 | 7 | 8 | 9 | 10 |
| 11 | 12 | 13 | 14 | 15 | 16 | 17 |
| 18 | 19 | 20 | 21 | 22 | 23 | 24 |
| 25 | 26 | 27 | 28 | 29 | 30 | 31 |
Tags
- 데이터분석초격차패치지
- SQL부분불일치
- SQL부분일치
- 파이썬
- MegabyteSchool
- MegaCon
- Append
- AI컨퍼런스
- 내일배움카드
- Carrying Capacity
- K디지털그레딧
- dropna
- 패스트캠퍼스
- 데이터분석초격차패키지
- Aha Moment
- 데이터분석인강
- 바이트디그리
- 엑셀기초통계
- SQL와일드카드
- 데이터컨퍼런스
- POP
- NotNull
- index
- Toss PO SESSION
- Python
- 스타트업
- 결측값
- K디지털크레딧
- MegaCon2022
- 메가바이트스쿨
Archives
- Today
- Total
da-ta ta-da
데이터 분석 인강 5주차 : Push 발송 시간, 로그 데이터 본문
1. Push 발송 시간대 의사결정
- 가장 주문이 많이 일어나는 피크 시점을 분석해 Push 발송하기
order_by_hour = retail.set_index('InvoiceDate').groupby(lambda date: date.hour).count()['CustomerID'] # 가장 주문이 많은 시간대 확인

def half_an_hour(date): # 구매 시간대 30분 단위로 분석하기
    minute = ":00"
    if date.minute > 30:
        minute = ":30"
    hour = str(date.hour)
    if date.hour < 10:  # 깔끔한 표기를 위해
        hour = '0' + hour
    return hour + minute
order_by_hour_half = retail.set_index('InvoiceDate').groupby(half_an_hour).count()['CustomerID']
- Push 개인화
- 유저별로 구매 시점이 다름, 가장 많이 구매한 시간대를 찾아 해당 시간대에 Push 발송
# 사용자별 시간별 주문량
order_count_by_hour = retail.set_index('InvoiceDate').groupby(['CustomerID', lambda date: date.hour]).count()['StockCode']
order_count_by_hour

# 사용자별 주문 피크 타임
idx = order_count_by_hour.groupby('CustomerID').idxmax()
result = order_count_by_hour.loc[idx]
2. 로그 데이터
- 웹서버 로그 데이터를 활용해 Funnel 분석 가능
- 웹서버 로그 데이터: 유저 행동을 로그로 기록하는 파일; ip, session id, user id, datetime, request, url 등으로 구성
# 연산을 위해 datetime 포맷으로 변경
logs['datetime'] = logs['datetime'].apply(lambda date: date.replace('[', '').replace(']',''))
logs['datetime'] = pd.to_datetime(logs['datetime'], format ='%d/%b/%YT%H:%M:%S')

# 퍼널 스텝 dataframe 생성
funnel_dict = {'/product_list' : 1, '/product_detail' : 2, '/cart' : 3, '/order_complete' : 4}
funnel_steps = pd.DataFrame.from_dict(funnel_dict, orient = 'index', columns = ['step_no'])

grouped = logs.groupby(['session_id', 'url'])['datetime'].agg(np.min) # 동일한 유저가 다른 세션으로 접속한 케이스는 분리해서 분석해야 하므로 user_id가 아닌 session_id를 기준으로 그루핑, session_id와 url로 그루핑하여 가장 빠른 시간대의 이벤트 추출(유저 여정이 다양하므로)
grouped = pd.DataFrame(grouped).merge(funnel_steps, left_on = 'url', right_index = True)

funnel = grouped.reset_index().pivot(index = 'session_id', columns = 'step_no', values = 'datetime')
funnel.columns = funnel_steps.index

# 퍼널별 카운트
step_values = [funnel[index].notnull().sum() for index in funnel_steps.index] # for문 output을 즉시 리스트로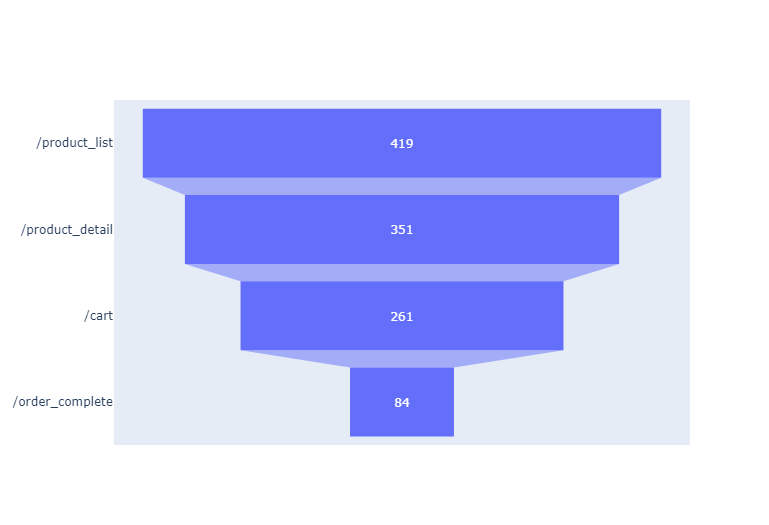
'Data Analyst' 카테고리의 다른 글
| 데이터 분석 인강 5주차 : 쇼핑몰 주문 데이터 분석 (0) | 2022.05.22 |
|---|---|
| 데이터 분석 인강 4주차 : 마케팅 데이터 분석 (0) | 2022.05.15 |
| 데이터 분석 인강 3주차 : 데이터 시각화 분석 실전 (0) | 2022.05.08 |
| 데이터 분석 인강 3주차 : Seaborn (0) | 2022.05.08 |
| 데이터 분석 인강 3주차 : Pandas (0) | 2022.05.08 |
'Data Analyst' Related Articles
more


Comments